Testing
This page describes the larger sets of testing done while building the robot. This does not include general software debugging and iterative testing of smaller features.
Localization Simulation
To test the localization algorithm without having to compensate for erorrs in sensor measurements, we performed intial testing in simulations on the web interface, without the robot connected.
A lidar data generation module was developed that takes the desired position and heading as inputs, and outputs a set of LIDAR readings reflecting the KnownMap fixture. The position given to that module was set to match the mouse cursor position to allow us to easily test in various locations. The esimated position was set to a rounded version of the mouse cursor position to introduce some error. The localization and display code was unchanged.
These simulations were used to adjust the various parameters in the localization code to attempt to make it as accurate as possible. We were able to consistently calculate the robot’s actual position from the rounded estimate in all locations except the top right corner, where the code consistently failed to identify the landmarks for unknown reasons. We did not record any results of these simulations as they were performed.
This test determined that, although the localization algorithm works, it is not accurate enough to use in real-world environments and further improvments are needed.
Test Environment
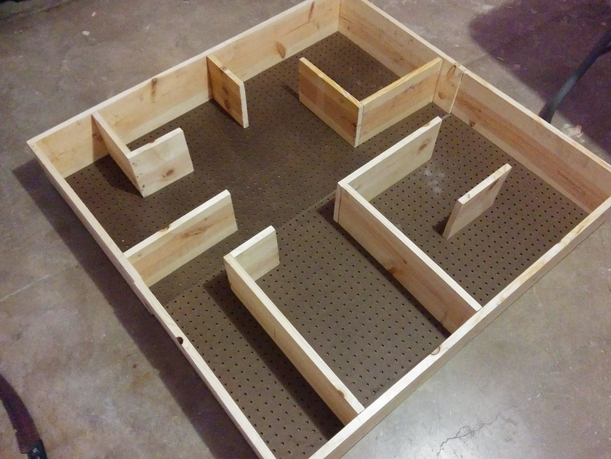
To simulate what a cleanroom environment might look like for the SLAMbot and to test the localization algorithm using real-world data, a 4x4 foot grid was constructed. The base of the grid was pegboard, and #2 pine wood was used for the walls. The walls are 8 inches high, making them just slightly taller than the robot so that the LIDAR is capable of detecting them. All passages are at least 7 inches wide to give the robot enough room to drive and turn in all locations. All walls are at 90 degree angles as expected by the software.
The exact locations of all walls after building was slightly off from our design as we used hand tools to build it, thus we measured the position of the bottom-left and top-right corner of each wall, relative to the bottom left corner of the environment. These values were programmed into the software as described in the Software > Data Fixtures page.
One of the requirements for the SLAMbot would be to the ability of its equipped air sensor to discern between a clean air environment and a dirty environment. To this end, the bottom right corner of the physical grid was sealed off from the rest of the grid using plastic coverings, with a single entrance for the robot. This section of the grid was artificially altered as described below so that the air quality within it would be much worse than the rest of the exposed grid. The SLAMbot must successfully report back much higher particle readings while it is in this sealed off section compared to when it is not.
Localization in Test Environment
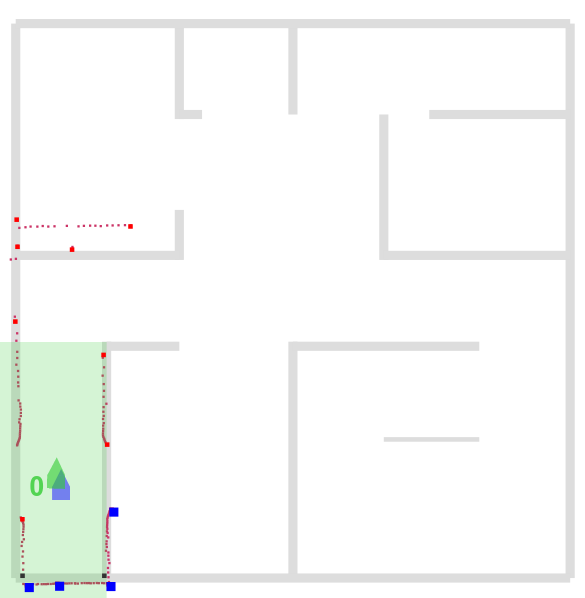
Once a part of the localization algorithm was working in simulation, the software was changed to use LIDAR data and the robot was placed in the environment. A screenshot of the web interface map showing the localization algorithm working is shown on the left. In the screenshot, the top half has not been programmed into the software, only the bottom half. The robot was placed approximately in the center of the bottom-left section, slightly closer to the bottom, and the initial position was set to be x,y=10,12cm. The blue arrow indicates that initial position, and the green arrow indicates the calculated position. Small red dots indicate LIDAR readings and larger red dots indicated detected landmarks. The expected landmarks are the two bottom corners. Large blue squares indicate the filtered landmarks part-way through the algorithm; in this particular set of readings it was not able to narrow it down to exactly two landmarks and thus aborted the localization calculation with the same calculated position as for the previous set of readings.
The localization algorithm did not work well when the estimated position was significantly different from the actual position. We did not expect it to work well when the difference was large, however the error tolerance of the algorithm was less than expected (about 5 centimeters, determined by informal observation). This limits the maximum distance the robot can travel between LIDAR readings.
The localization algorithm failed completely in both the top-right corner (as did the simulation), and in the center of the map.
We did not have sufficient time to test the algorithm while the robot was driving significant distances, as this required first implementing robot “poses” which merge the estimated and calculated positions. Without poses, the estimated position accumulated error and became useless after several seconds.
This test determined that the algorithm works only slightly worse in reality as in simulation. Some changes to the algorithm parameters could improve it further, but a better improvment seems to be detecting landmarks in a smarter fashion.
Smoke Generator
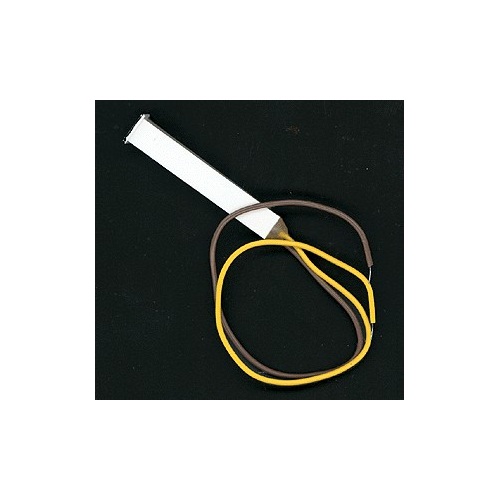
To artificially create the polluted section of the environment, a simple model train smoke generator was purchased. The model chosen was the Seuthe 117e as it is capable of running on a single DC voltage, and was locally available. It generates by filling it with a specially-designed oil and applying a voltage between 16 and 18V to a heating element. This heats the oil, causing it to smoke.
The smoke generating unit was placed inside the sealed corner of the grid in the corner opposite the entrance. The unit was powered with a standard ATX power supply with 17V (generated from the -5V and 12V wires) located outside the environment, allowing us to switch it on or off, or run it continuously, as desired. The smoke generator was then allowed to run for several minutes while the robot collected readings in another part of the environment, then the SLAMbot drove inside the sealed area to take readings in the polluted air.
An expected challenge was that, due to the low quality of the air sensor used, readings increase significantly when the robot is moved. This is caused by the increased airflow through the sensor, as it does not take the amount of air passing through it into account. During normal operation, when the robot drives a small increase is seen in the readings.
We were able to observe a significant increase in air particle count as reported by the air quality sensor when the robot entered the sealed area. This increase was similar to that observed when the robot is driven normally, however it did not decrease back to normal when the robot stopped moving. This indicates the readings were due to the smoke generator and not the robot’s movement.
This test determined that to properly detect particle counts, one or more of the following changes must be implemented in the robot’s design:
- The robot could only take readings while stationary. This is undesirable as both taking readings and moving takes time, so this will decrease the total number of readings it is possible to obtain.
- The air quality sensor could control the amount of air flowing through the detection hardware so that it does not change when moved. This can be done by adding a fan. This was attempted by A.J. and was described on his blog. This had the additional benefit of improving the accuracy of the sensor.
- The air quality sensor could measure the airflow through it and change the units of the measurement to compensate.
Image credit for smoke generator: trainz.com product page